Highest Gold Price Ever: All-Time Highs and What Caused Them
Gold has captured human attention for thousands of years, but its modern price history tells a particularly compelling story. From the end of the gold standard to the turbulent markets of the twenty-first century, the metal has reached a series of record highs that each reflect something meaningful about the economic moment in which they occurred. Understanding what drove those peaks — and what conditions surrounded them — can help retirement investors think more clearly about gold’s role in a long-term financial plan.
This article walks through the highest gold price ever recorded, the major all-time highs along the way, and the economic forces that shaped each of them. It is not a forecast, and it does not recommend any action. It is simply a clear-eyed look at the historical record, because context matters when you are making serious financial decisions.
A Brief History of Gold Pricing in the United States
For most of American history, gold was not freely traded. Its price was fixed by the government, first at $20.67 per troy ounce under the gold standard and later at $35 per ounce under the Bretton Woods system established after World War II. When President Nixon ended the direct convertibility of the U.S. dollar to gold in 1971 — an event often called the “Nixon Shock” — the price of gold was allowed to float freely on open markets for the first time.
That decision set the stage for every gold price record that followed. As soon as gold could respond to supply and demand, investor sentiment, currency movements, and global events, its price began moving — sometimes dramatically.
If you are new to gold as an asset class, our Gold IRA hub offers a solid foundation before diving into the price history covered here.
The First Major Gold Price Surge: The 1970s
Once gold was freed from its fixed price in 1971, it moved quickly. By 1974, the price had climbed above $180 per troy ounce. But the most dramatic move of that era came at the end of the decade.
In January 1980, gold hit what was then an extraordinary record: approximately $850 per troy ounce. Adjusted for inflation, that figure translates to well over $3,000 in today’s dollars — a number that puts the scale of that rally in perspective.
What caused it? Several forces converged at once. The United States was experiencing severe inflation, with consumer prices rising at double-digit annual rates. The Federal Reserve had not yet embarked on the aggressive rate-hiking campaign that would eventually tame prices. Internationally, the Soviet Union had invaded Afghanistan, and the Iranian revolution had disrupted oil supplies. Investors were seeking assets that might hold their purchasing power during an unusually uncertain period.
The 1980 peak did not last. When Federal Reserve Chairman Paul Volcker raised interest rates sharply to fight inflation, gold fell steeply. It would take more than two decades for gold to approach those nominal price levels again.
The Long Bear Market and Gradual Recovery: 1980–2005
Between roughly 1980 and the early 2000s, gold spent most of its time in a prolonged decline and then slow recovery. Prices fell through the 1980s and 1990s, touching lows near $250 per ounce in 1999. Central bank gold sales during this period added downward pressure, as several major economies reduced their gold reserves.
The early 2000s marked a turning point. The bursting of the dot-com bubble, the September 11 attacks, and growing U.S. budget deficits began to shift sentiment. Gold gradually climbed through $400, then $500, then $600 per ounce over the mid-2000s. Most observers at the time considered these moves significant — though in retrospect, they were just the beginning of a much larger rally.
The 2011 All-Time High: A New Record
The global financial crisis of 2008 accelerated gold’s rise considerably. As credit markets froze and equity markets collapsed, gold initially fell — partly because investors sold assets across the board to raise cash — but it recovered quickly and resumed its upward trend through 2009 and 2010.
In September 2011, gold reached what was then its highest price ever: approximately $1,920 per troy ounce. This peak reflected a combination of factors that had been building for years. The U.S. Federal Reserve had implemented multiple rounds of quantitative easing, expanding its balance sheet significantly. The eurozone sovereign debt crisis was creating serious uncertainty about the future of the euro. U.S. government debt had just been downgraded for the first time in history by Standard & Poor’s. Investors around the world were seeking stores of value outside the traditional financial system.
As with 1980, the 2011 peak was followed by a multi-year decline. Gold fell from nearly $1,920 back toward $1,050 by late 2015 as the Federal Reserve signaled the end of its crisis-era monetary policies and the dollar strengthened. Past performance is not a guarantee of future results, and the 2011 experience illustrates clearly that gold prices can fall sharply from peak levels.
For investors considering gold as part of a retirement account, our Gold IRAs Explained in Detail page covers the structural and regulatory side of how that works.
The 2020 Record: Gold Surpasses $2,000 for the First Time
In August 2020, gold crossed $2,000 per troy ounce for the first time in history, reaching an intraday high of approximately $2,067. This was the new highest gold price ever at that point.
The context was the COVID-19 pandemic. Global economies had been effectively shut down. Central banks around the world responded with extraordinary monetary stimulus. The U.S. federal government passed multi-trillion-dollar relief packages. Interest rates were cut to near zero. Real yields — that is, yields adjusted for inflation expectations — turned deeply negative, meaning that holding government bonds was likely to erode purchasing power. In that environment, gold attracted substantial attention from institutional and individual investors alike.
The 2020 record was meaningful not just for its nominal level but for what it represented: the clearest breach of a round-number psychological threshold in gold’s modern history.
Gold Breaks Higher Again: The 2024 and 2025 Records
Gold’s story did not stop in 2020. After pulling back through 2021 and 2022 — partly in response to the Federal Reserve’s aggressive rate increases to combat post-pandemic inflation — gold resumed its upward trend in late 2023 and accelerated through 2024.
By early 2024, gold had surpassed its 2020 record. By late 2024 and into 2025, the metal was trading consistently above $2,700 per troy ounce, with multiple intraday records set along the way. At the time of writing, the highest gold price ever recorded stands above $3,100 per troy ounce, set in 2025.
Several factors have been cited by analysts as contributing to this sustained period of elevated prices: ongoing geopolitical tensions across multiple regions, continued central bank gold purchases (particularly from emerging market economies), elevated U.S. national debt levels, persistent concerns about long-term inflation, and sustained demand from Asian retail and institutional buyers.
It is important to note that these are observations about what has occurred — not a prediction about where prices will go next. Gold prices can and do fall, sometimes significantly and without obvious warning. Past performance is not a guarantee of future results.
A Timeline of Gold’s Highest Price Milestones
The table below summarizes the major all-time high milestones in gold’s modern price history. Figures are approximate and represent nominal (not inflation-adjusted) prices.
Note: All figures are nominal spot prices. Inflation-adjusted comparisons may produce different rankings. Past performance is not a guarantee of future results.
What Each Peak Has in Common
Looking across these price records, a few patterns emerge — though none of them constitute a reliable predictive model.
Each major gold price peak has coincided with a period of significant uncertainty in the broader financial or geopolitical environment. Each has also coincided with conditions in which the purchasing power of major currencies was under some form of stress, whether from inflation, currency debasement, or the expansion of central bank balance sheets.
Each peak has also been followed by a correction of varying depth and duration. That is a critical point for anyone who thinks about gold purely in terms of its record highs.
For investors who want to understand the mechanics of holding gold within a retirement account structure, our Gold IRA vs Traditional IRA comparison and Gold IRA vs 401(k) overview both cover the key structural differences clearly. You should also review the IRS IRA investment FAQ and FINRA’s guidance on self-directed IRAs before making any decisions.
Gold IRAs and Price History: What Investors Should Understand
For retirement investors specifically, understanding gold’s price history is useful context — but it is only one part of a much larger picture. If you are considering a Gold IRA, the mechanics of how these accounts work, what they cost, and what rules govern them are equally important.
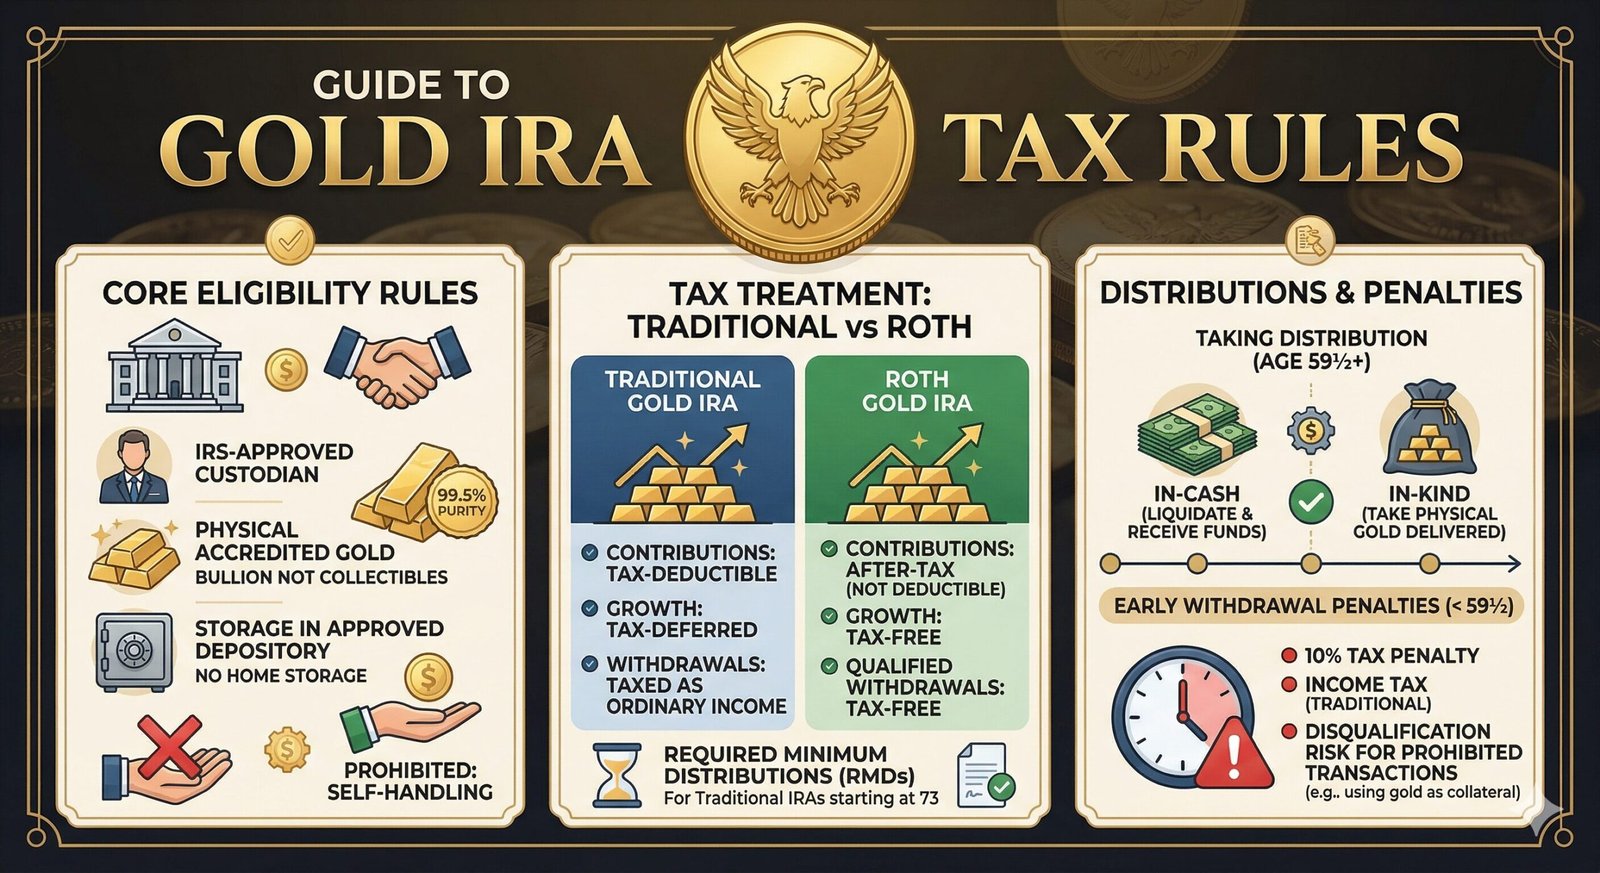
Gold held in an IRA must meet IRS purity standards (0.995 fineness or higher for gold bullion), must be held by an approved custodian, and must be stored in an IRS-approved depository. You can learn more about eligible holdings in our guide to IRA-eligible gold coins. Our Gold IRA fees guide covers the ongoing costs involved, which can be meaningful over time. And if you are thinking about moving funds from an existing retirement account, our 401(k) to Gold IRA rollover guide and Gold IRA rollover rules page explain the process and the rules that govern it.
The IRS sets contribution limits and required minimum distribution rules that apply to Gold IRAs just as they do to traditional IRAs. You can find the current rules directly at IRS Publication 590-A and the IRS RMD FAQ. Always verify current figures with a qualified tax professional.
If you are still weighing whether this type of account makes sense for your situation, our page on is a Gold IRA a good idea walks through the key considerations in plain language.
FAQ: Highest Gold Price Ever
What is the highest gold price ever recorded?
As of 2025, the highest gold price ever recorded exceeds $3,100 per troy ounce, set during the first half of 2025. This surpassed the previous record of approximately $2,067 set in August 2020.
Was the 1980 gold price higher when adjusted for inflation?
Yes. When adjusted for inflation, the 1980 peak of approximately $850 per troy ounce translates to well over $3,000 in today’s dollars, making it comparable to — and by some calculations higher than — recent nominal records. This illustrates why both nominal and inflation-adjusted figures matter when reviewing historical prices.
What has historically driven gold to record highs?
Major gold price peaks have typically occurred during periods of elevated inflation, significant geopolitical stress, aggressive monetary expansion, or a combination of these factors. However, correlation is not causation, and past conditions do not reliably predict future price behavior.
Can gold prices fall from record highs?
Yes, and they have done so repeatedly. After the 1980 peak, gold fell by more than 60% over the following years. After the 2011 peak, it fell by more than 40% before recovering. Anyone considering gold should understand that its price can decline significantly from any level, including all-time highs. Past performance is not a guarantee of future results.
How do I research Gold IRA companies before making a decision?
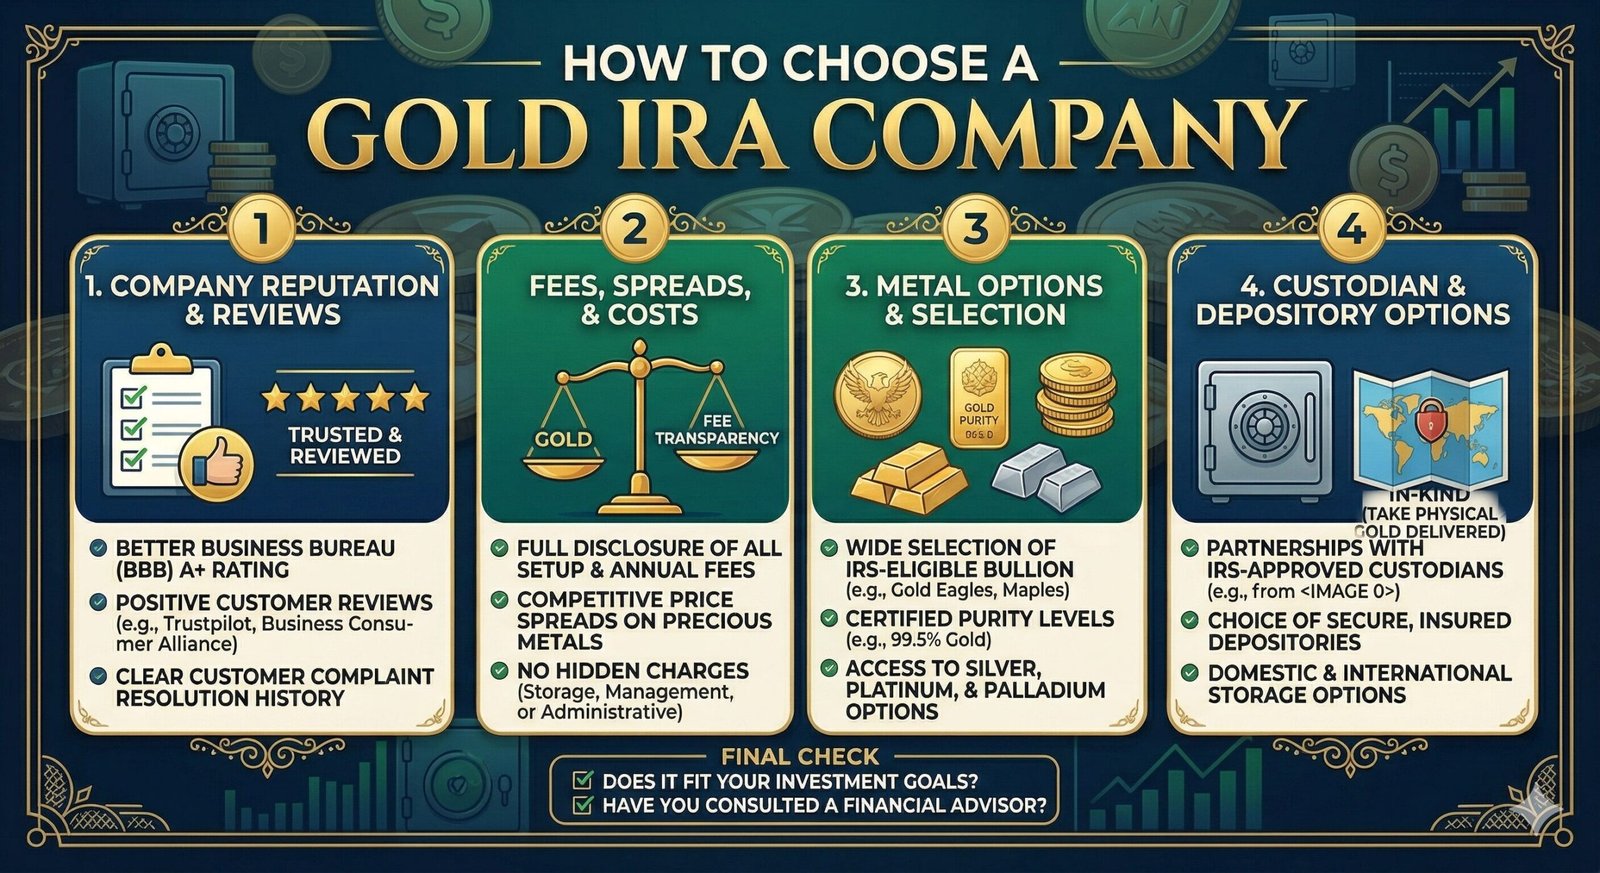
Start with independent sources. Check company ratings at bbb.org, review any regulatory history through FINRA BrokerCheck, and read our Gold IRA scams guide to understand the common warning signs. Also review our Gold IRA minimum investment page to understand the upfront requirements different companies impose.
Ready to Research Your Options?
Understanding the history behind gold’s highest prices is a meaningful starting point — but it is just the beginning of the research process for retirement investors. If you are ready to compare the leading companies in this space, our independent review of the Best Gold IRA Companies of 2026 covers fees, minimums, customer service, storage options, and more in one place.
This article is for informational purposes only and does not constitute financial or tax advice. Investing in precious metals involves risk including possible loss of principal.