Gold Price 2026: Current Value, Historical Context, and Outlook
Gold has long occupied a unique place in the financial world. For retirement investors in particular, understanding what drives the price of gold — and how to think about it clearly and without hype — is a worthwhile exercise. This article examines the gold price landscape in 2026, reviews the historical context that gives today’s figures meaning, and outlines the key factors that market analysts watch when discussing where gold prices may go from here.
One thing to state clearly at the outset: this article does not predict future gold prices, and nothing here constitutes investment advice. As with any asset, past performance is not a guarantee of future results. What follows is educational context designed to help you ask better questions and make more informed decisions.
What Is the Gold Price in 2026?
As of 2026, gold has remained one of the most closely watched commodities in global financial markets. The spot price of gold — the real-time price for immediate delivery — is quoted in U.S. dollars per troy ounce and fluctuates throughout every trading day based on a complex web of supply, demand, currency movements, and macroeconomic conditions.
Gold is traded on major exchanges including the COMEX division of the New York Mercantile Exchange and the London Bullion Market. The London Bullion Market Association (LBMA) sets twice-daily benchmark prices — the “gold fix” — which serve as a global reference point for institutional and retail investors alike.
For the most current spot price, it is always best to consult a live financial data source such as Bloomberg, Kitco, or your brokerage platform. Published articles, including this one, cannot substitute for real-time data when you are evaluating a specific financial decision.
A Brief History of Gold Prices: How Did We Get Here?
Understanding the 2026 gold price requires looking backward. Gold’s price history is neither a straight line upward nor a record of steady calm — it is a story of long plateaus, sharp rises, and significant corrections.
The Post-Gold Standard Era
When the United States fully abandoned the Bretton Woods gold standard in 1971, gold transitioned from a fixed-price monetary instrument into a freely traded commodity. Through the 1970s, gold prices rose sharply amid high inflation and geopolitical tension, before entering a long bear market that stretched through most of the 1980s and 1990s.
The 2000s Bull Market
The early 2000s marked a turning point. Gold began a sustained multi-year rise that eventually carried prices from below $300 per troy ounce to above $1,900 by September 2011 — a peak that reflected the financial crisis of 2008, subsequent quantitative easing programs, and broad uncertainty in credit markets. It is worth restating: past performance is not a guarantee of future results, and that period’s gains do not imply a similar trajectory going forward.
The 2011–2018 Correction and Recovery
Following its 2011 peak, gold entered a prolonged correction, falling back toward the $1,100–$1,200 range by 2015 and 2016. A gradual recovery followed, and by 2019 gold had reclaimed the $1,500 level. This phase is a useful reminder that gold, like any asset, can experience extended periods of declining or flat prices.
2020 Onward: A New Era of Higher Prices
The disruptions of 2020 pushed gold to new nominal highs above $2,000 per troy ounce for the first time. The years that followed saw gold consolidate, pull back, and then push higher again as central bank buying accelerated globally, particularly among non-Western central banks seeking to reduce exposure to the U.S. dollar. By 2024 and 2025, gold had established itself firmly at elevated nominal levels, and 2026 prices continue to reflect this structural shift in global demand patterns.
None of this constitutes a forecast. It is simply the historical record, offered so that today’s prices can be understood in proper context.
Key Drivers of the Gold Price
Gold does not behave like a stock or a bond, and it does not generate dividends or interest. Its price is driven by a distinct set of forces that retirement investors should understand before incorporating any gold-related strategy into their financial planning.
Interest Rates and Real Yields
One of the most widely cited relationships in gold market analysis is the inverse correlation between gold prices and real interest rates (nominal interest rates minus inflation). When real yields on U.S. Treasury bonds are low or negative, the opportunity cost of holding gold — which pays no income — is reduced, and demand for gold tends to rise. Conversely, when real yields are high, gold can face headwinds. The Federal Reserve’s interest rate decisions are therefore watched closely by gold market participants.
The U.S. Dollar
Gold is priced in U.S. dollars globally, which means the value of the dollar has a direct mechanical effect on gold’s price as seen by international buyers. When the dollar weakens, gold typically becomes cheaper in other currencies, which can stimulate demand. When the dollar strengthens, the reverse can occur. This relationship is not absolute — both can rise or fall together in certain conditions — but it is one of the most consistent patterns analysts observe.
Central Bank Demand
Over the past several years, central banks — particularly in China, India, Turkey, Poland, and other emerging market economies — have significantly increased their gold reserves. According to data from the World Gold Council, central bank gold purchases reached historically elevated levels in 2022 and 2023. This structural demand from sovereign buyers represents a meaningful component of total global gold demand and is a factor many analysts watch in 2026.
Inflation and Purchasing Power
Gold is frequently discussed in the context of inflation. While gold has shown periods of correlation with inflation over certain long time horizons, the relationship is inconsistent over shorter periods. This article does not characterize gold as “inflation-proof” — no investment carries that label honestly — but it is fair to say that the relationship between inflation expectations and gold demand is one that analysts routinely examine.
Geopolitical and Macroeconomic Uncertainty
Periods of elevated geopolitical tension or financial market stress have historically coincided with increased investor interest in gold. This is a pattern, not a rule, and it does not mean gold will rise in any specific future period of uncertainty. Investors reviewing gold’s role in their retirement planning should approach this relationship with appropriate nuance.
What Does the Gold Price Mean for Retirement Investors?
For investors aged 45 to 70, the gold price is relevant in a specific way: it determines the current value of any gold holdings, and it directly affects the economics of opening or contributing to a Gold IRA.
A Gold IRA is a self-directed individual retirement account that holds physical gold (and other approved precious metals) rather than paper assets. If you are unfamiliar with the structure, our Gold IRA guide covers the fundamentals, and Gold IRAs Explained in Detail goes further into the mechanics.
The current gold price affects how much physical gold you can acquire for a given dollar amount. When gold prices are high, the same contribution buys fewer ounces. When prices are lower, contributions stretch further in terms of physical weight. Neither scenario is inherently “better” — this is simply how commodity-based assets work, and it is one reason financial professionals emphasize long-term thinking over short-term price timing.
Gold IRA Rules and Contribution Limits
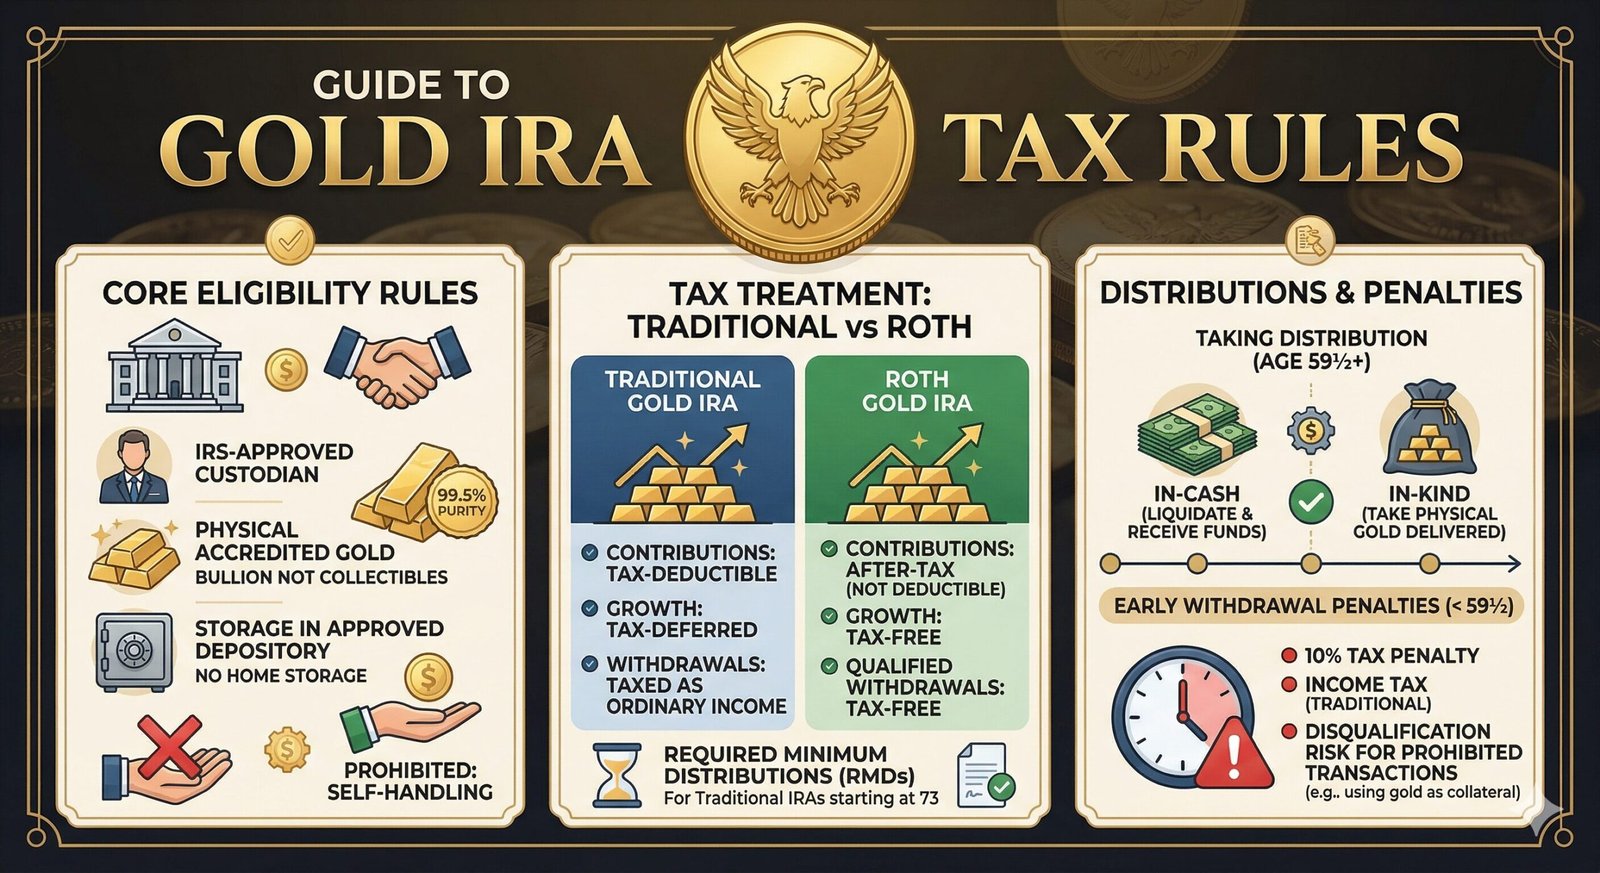
Gold IRAs are subject to the same annual contribution limits as traditional and Roth IRAs. For 2026, those limits are set by the IRS and apply regardless of what the gold price is doing. You can review current figures at the IRS contribution limits page. Gold IRAs also carry required minimum distribution (RMD) rules at age 73 — the IRS RMD FAQ explains these in full.
For investors who want to move existing retirement funds into a Gold IRA, our 401(k) to Gold IRA rollover guide and Gold IRA rollover rules page explain both the process and the regulatory constraints.
Fees, Storage, and the True Cost of Gold Ownership in an IRA
One factor the spot price alone cannot capture is the total cost of owning gold through a retirement account. Gold IRAs carry fees that traditional IRAs typically do not — including custodian fees, account setup charges, and storage fees for IRS-mandated depositories. Our Gold IRA fees guide breaks down what to expect.
Understanding these costs is essential to evaluating any Gold IRA arrangement accurately. You should also review our page on IRA-eligible gold coins to understand which specific products meet IRS purity requirements.
Before opening any account, it is worth reviewing FINRA’s guidance on self-directed IRAs and the SEC investor resources page on retirement accounts. Both offer independent, regulatory-body perspectives on the responsibilities and risks involved.
Evaluating Gold IRA Companies in 2026
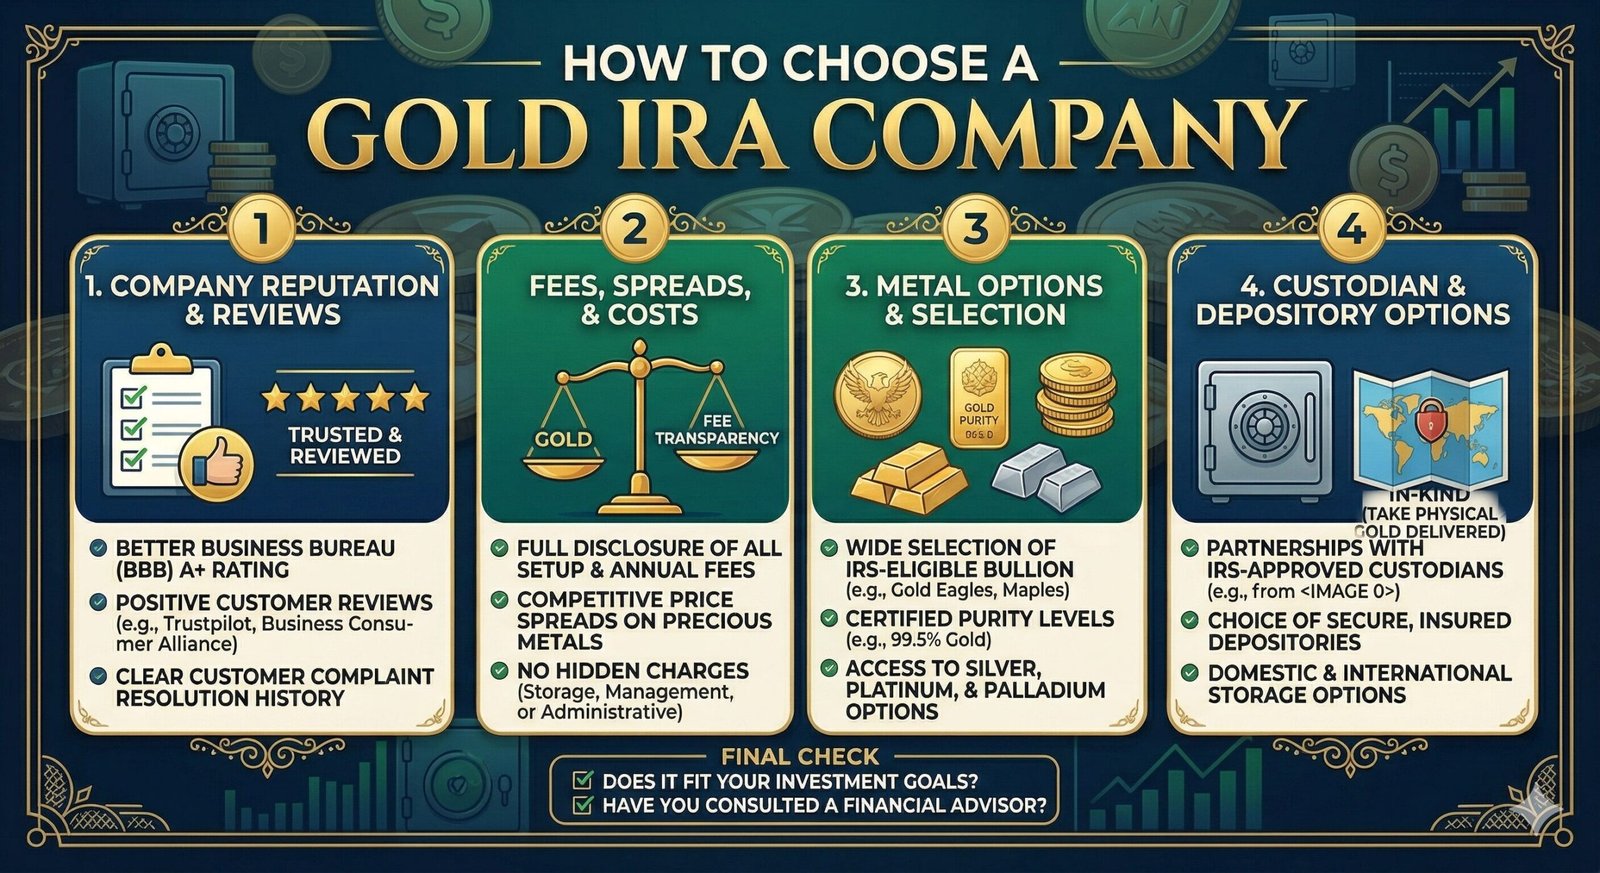
The gold price environment in 2026 has led to renewed interest in Gold IRAs among retirement investors. With that interest comes a responsibility to evaluate providers carefully. Not all Gold IRA companies operate with the same standards of transparency and customer service.
When evaluating any company, look for verifiable ratings from independent sources such as bbb.org and confirm any financial representatives through FINRA BrokerCheck. Our Gold IRA scams guide covers the warning signs to watch for in provider marketing and sales approaches.
It is also worth considering whether a Gold IRA is the right structure for your situation in the first place. Our page on is a Gold IRA a good idea and the Gold IRA vs Traditional IRA comparison address the structural trade-offs involved. You may also find the Gold IRA minimum investment page useful, as many providers set account minimums significantly higher than those of conventional IRAs.
Frequently Asked Questions About the Gold Price in 2026
What is the gold price in 2026?
The spot price of gold changes throughout every trading day. For a real-time figure, consult a live financial data source such as Kitco, Bloomberg, or your brokerage platform. Published articles cannot provide up-to-the-minute pricing.
Why does the gold price change so frequently?
Gold is traded continuously on global markets, and its price responds to real-time changes in currency values, interest rate expectations, central bank activity, geopolitical developments, and overall investor sentiment. Like any traded asset, it reflects the collective behavior of buyers and sellers across multiple exchanges.
Does the current gold price affect whether I should open a Gold IRA?
The current price affects how much physical gold your contributions will purchase, but the decision to open a Gold IRA involves far more than spot price timing — including your broader financial goals, time horizon, existing retirement assets, and the full cost structure of the account. Speaking with a licensed financial advisor is strongly recommended before making any such decision.
Is gold a good investment in 2026?
This article does not provide investment advice, and whether gold is appropriate for your situation depends on your individual circumstances. We encourage you to review independent regulatory resources such as IRS Publication 590-A and consult a qualified financial professional.
How has the gold price historically performed during recessions?
Gold’s price behavior during economic downturns has varied considerably across different historical periods. There is no consistent pattern that would support a blanket characterization. Past performance is not a guarantee of future results, and any claims to the contrary should be treated with skepticism.
Take the Next Step
If you are researching gold as part of your retirement planning in 2026, understanding the price environment is a sound starting point — but it is only one piece of a larger picture. Evaluating reputable providers, understanding the regulatory framework, and reviewing all associated costs are equally important steps.
For a comprehensive look at the top-rated providers in the market today, visit our Best Gold IRA Companies of 2026 page, where we review the leading custodians based on transparency, fees, customer service ratings, and regulatory standing.
This article is for informational purposes only and does not constitute financial or tax advice. Investing in precious metals involves risk including possible loss of principal.