Gold Ticker Test
Paid Partnership: We may earn a commission from links on this page. View Disclosure and Terms

Gold ▼ -0.08% to $4846.00 — Daily Market Summary, April 15, 2026

The Gold Investing Starter Kit cover showing gold bars and market chart by GoldInvesting.net

Get Your Free Gold Investing Starter Kit

Join thousands of readers and receive expert tips straight to your inbox

Disclosure: If you request the guide through our link, we may earn a commission at no extra cost to you.

Gold Price: $4846.00 -0.08%

Market Conditions: Consolidation Phase

Gold consolidated with a negligible 0.08% decline near $4,846, held in check by a slight dip in the 10-Year Treasury yield to 4.26% and a steady dollar. Equity strength, led by Nasdaq’s 1.96% advance and Microsoft’s gains, capped gold’s upside, while subdued GLD ETF flows underscored balanced investor positioning. This calm precedes potential volatility tied to yield movements and geopolitical or economic catalysts.

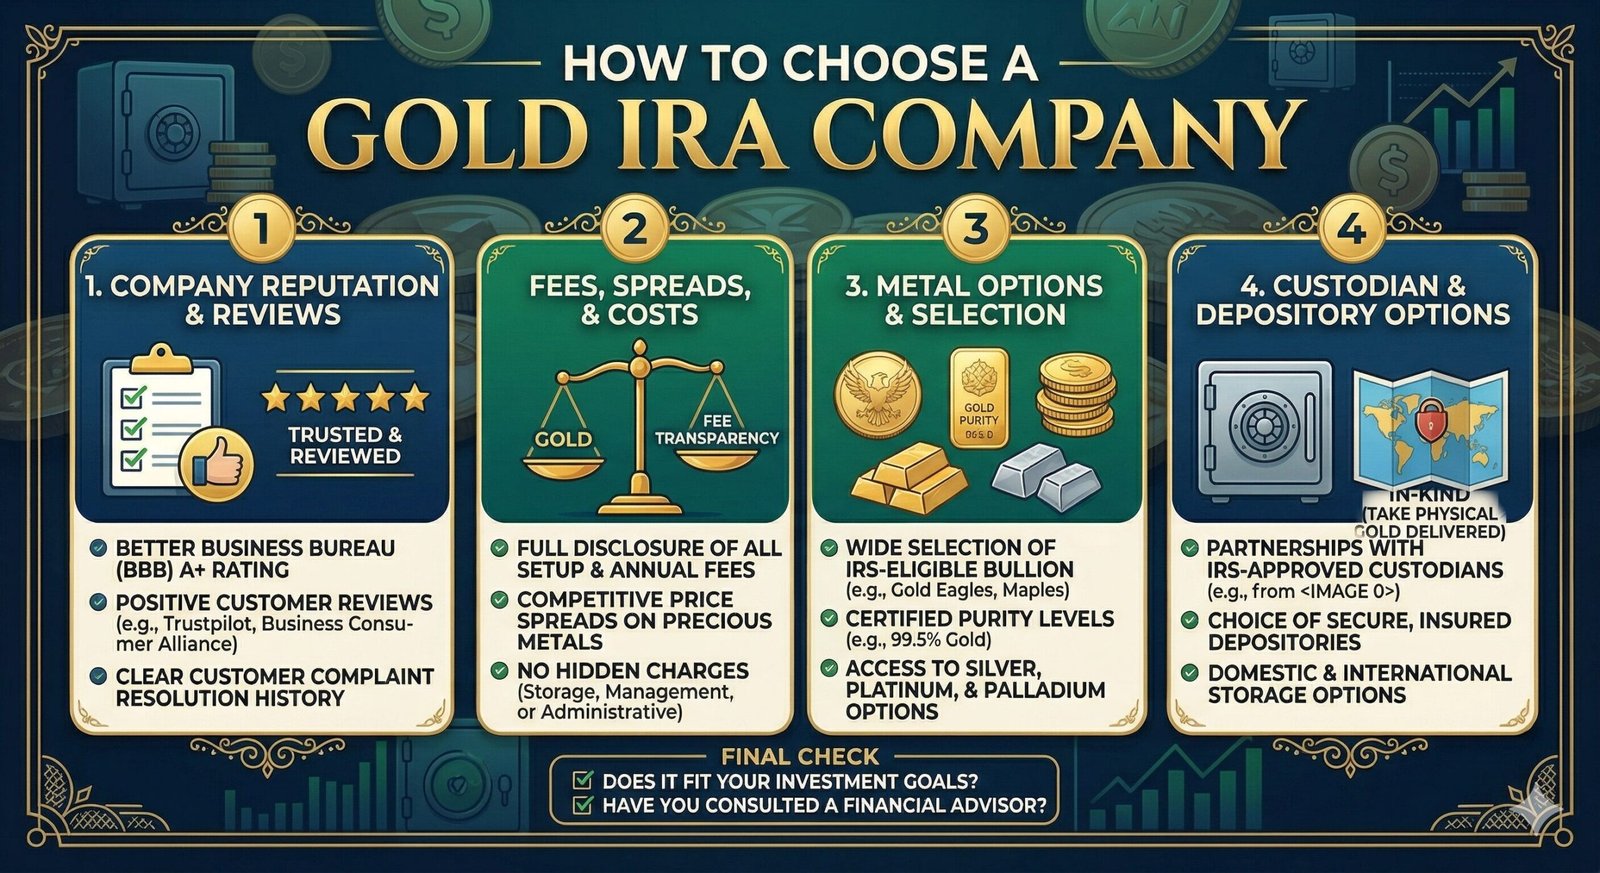
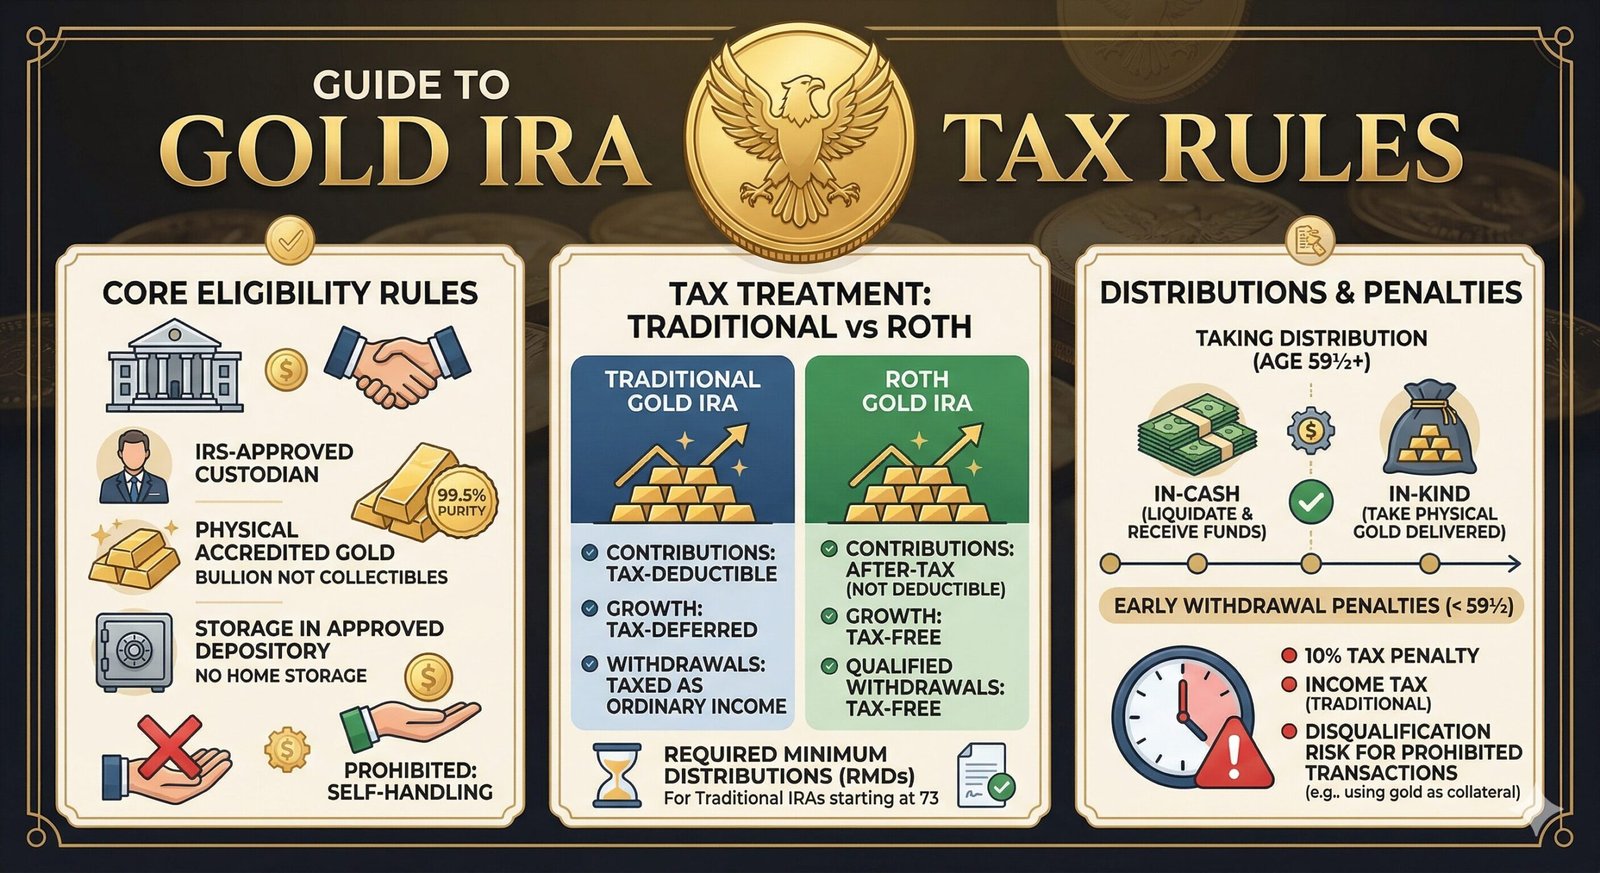
For investors reviewing portfolio positioning, our gold IRA guide outlines how physical gold fits a long-term strategy. You can also best gold IRA companies to find the right custodian. Market data referenced via the World Gold Council.


AI-generated market summary • Data sources: TradingView, Yahoo Finance, Nasdaq, MarketWatch • Published on April 15, 2026 • This does not constitute financial advice.

Share this article on

Scroll to Top

Get Your Free Gold Investing Starter Kit

Join thousands of readers and receive expert tips straight to your inbox

Gold Investing Starter Kit

Methodology Disclosure - GoldInvesting.net

Purpose & Limitations: This tool is for educational purposes and provides numerical estimates only. It is not intended to be relied upon for making financial decisions and does not constitute a recommendation or a statement of opinion.

Default Assumptions: * Spot Price: Estimates are based on real-time market data from third-party APIs (e.g., TradingView). Prices are updated approximately every 60 seconds.

Growth Rates: The default annual growth rate is set at 2% as a neutral baseline. Users are encouraged to adjust this figure to test various hypothetical scenarios.

Valuation Factors: Valuation estimates do not account for dealer premiums, tax liabilities, or specific purity variances unless explicitly input by the user.

No Fiduciary Duty: The use of this tool does not create an advisor-client relationship. Users should consider obtaining advice from a licensed financial services professional before making investment decisions.