Gold Price in 2021: Year in Review and Key Drivers
For anyone who follows precious metals closely, 2021 was a year worth understanding. After a dramatic surge in 2020, gold entered the year with considerable momentum — and then spent much of the following twelve months pulling back, consolidating, and responding to a series of macroeconomic forces that few investors had experienced in their lifetimes. Whether you are researching gold as part of your retirement planning or simply trying to understand how gold behaves across different economic conditions, a clear-eyed look at 2021 offers a useful foundation.
This article breaks down the key price movements of gold in 2021, the major forces that shaped those movements, and what any of it means for retirement investors thinking about physical gold or a Gold IRA today. Remember: past performance is not a guarantee of future results, and nothing here constitutes financial advice.
Where Gold Started — and Where It Ended in 2021
Gold began 2021 at approximately $1,900 per troy ounce, riding the tailwinds of its remarkable performance the prior year. By early January, however, prices had already begun to soften, and the metal would spend a considerable portion of the year trading in a range broadly between $1,680 and $1,900 per ounce.
The year’s low came in March 2021, when gold briefly touched around $1,680 — a notable pullback from its all-time high of over $2,070 set in August 2020. Gold did mount a recovery through the middle months of the year, returning toward $1,900 in late May and early June before pulling back again. By year’s end, gold was trading in the vicinity of $1,800 per ounce, closing out 2021 with a modest decline for the calendar year.
It is worth emphasising again: this is historical data, and past performance is not a guarantee of future results. Price movements in any prior year do not tell us what gold will do next.
The Key Drivers of Gold’s Price in 2021
Understanding what moved gold in 2021 requires looking at several intersecting forces. Gold does not move in isolation — it responds to a complex mix of monetary policy, currency dynamics, inflation expectations, and investor sentiment.
Rising Real Yields and the U.S. Dollar
One of the most significant headwinds gold faced in 2021 was the sharp rise in U.S. Treasury yields, particularly in the first quarter. As the rollout of COVID-19 vaccines accelerated and economic optimism grew, investors began pricing in a faster-than-expected recovery. This pushed nominal yields higher — and real yields (nominal yields adjusted for inflation expectations) also moved upward during certain periods.
Gold is often sensitive to real yield movements. When real yields rise, the opportunity cost of holding a non-yielding asset like gold increases, which can weigh on demand from institutional investors. This dynamic played a meaningful role in the first-quarter decline.
At the same time, the U.S. dollar experienced periods of strength in 2021, particularly in the second half of the year. Because gold is priced in U.S. dollars, a stronger dollar generally makes gold more expensive for buyers using other currencies, which can soften global demand.
Inflation — A Complex Relationship
2021 was a year in which inflation became one of the dominant economic conversations. U.S. consumer price inflation accelerated sharply through the middle and latter parts of the year, driven by supply chain disruptions, labour shortages, and stimulus-driven demand. By November 2021, U.S. CPI had reached levels not seen in roughly four decades.
Gold’s relationship with inflation in 2021 was complicated and instructive. Despite elevated inflation readings, gold did not sustain a meaningful rally during the same period. This reflects the fact that gold’s relationship with inflation is not mechanical or predictable — it is shaped by the broader monetary policy environment, real yield levels, and investor positioning at any given moment.
For retirement investors, this is an important nuance to absorb. Gold’s behaviour can differ significantly from one inflationary environment to the next, and no one should assume a direct or guaranteed correlation.
Federal Reserve Policy and Tapering Expectations
Throughout 2021, the Federal Reserve repeatedly characterised rising inflation as “transitory” — a stance it maintained through much of the year before pivoting in late 2021. In November, the Fed announced it would begin tapering its monthly asset purchases, signalling a shift toward tighter monetary policy. This announcement, and the anticipation leading up to it, contributed to pressure on gold prices in the second half of the year.
The prospect of rate hikes in 2022 — which the Fed began to signal more explicitly by year’s end — also weighed on sentiment around gold, as rising short-term rates typically support the U.S. dollar and real yields simultaneously.
What 2021 Illustrates About Gold as an Asset
The year 2021 demonstrated that gold does not move in a straight line, and that understanding its price behaviour requires looking at multiple variables simultaneously. It also showed that gold can face meaningful pressure in environments where yields are rising and economic optimism is high — even when inflation is elevated.
None of this makes gold a poor choice for retirement investors. It simply means that anyone considering physical gold or a Gold IRA should approach it with realistic expectations and a thorough understanding of how the asset behaves. If you are new to the topic, our Gold IRA hub is a good place to start, and Gold IRAs Explained in Detail goes deeper into how these accounts work in practice.
Gold IRA Considerations for Retirement Investors
If 2021 prompted you to think more carefully about the role physical gold might play in your retirement accounts, it is worth understanding the structural details of a Gold IRA before making any decisions.
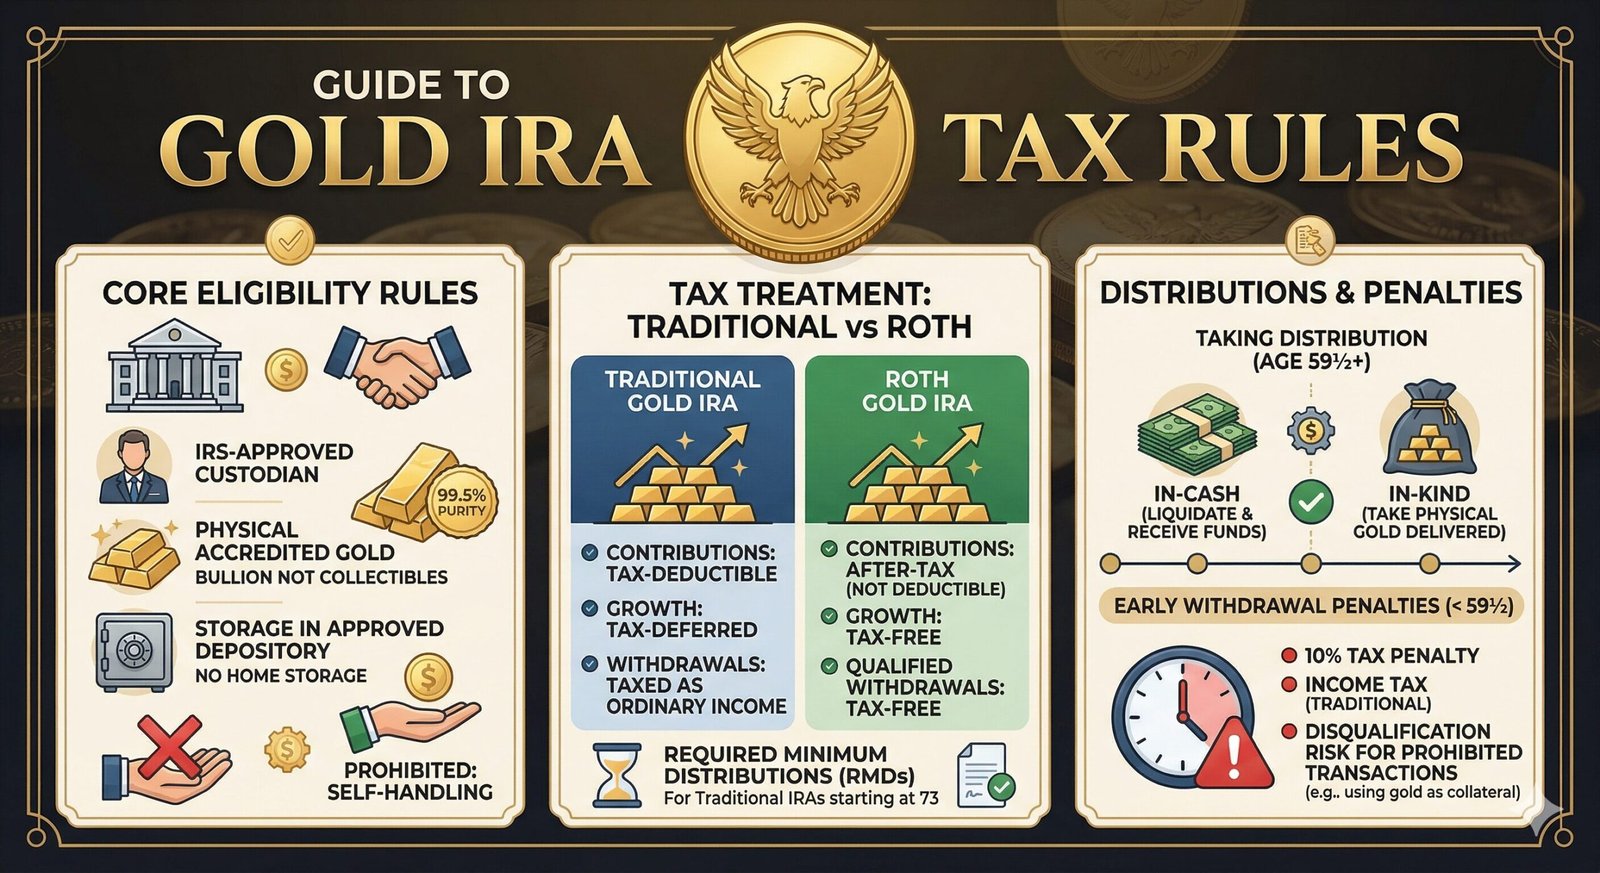
A Gold IRA is a self-directed individual retirement account that holds IRS-approved physical precious metals rather than paper assets. The IRS sets specific purity and form requirements for eligible metals — you cannot simply purchase any gold coin or bar. For a full breakdown of eligible products, take a look at our guide to IRA-eligible gold coins.
The IRS IRA investment FAQ provides authoritative guidance on what types of assets are permissible within a self-directed IRA, and FINRA’s guidance on self-directed IRAs offers useful context on the additional responsibilities and risks these account structures carry.
Costs and Account Minimums
Gold IRAs carry fees that standard IRAs typically do not — including custodian fees, storage fees, and sometimes account setup charges. Our Gold IRA fees guide provides a detailed breakdown of what to expect. Before committing to any provider, it is also worth reviewing the Gold IRA minimum investment requirements, which vary considerably between companies.
Rolling Over Existing Retirement Funds
Many retirement investors fund a Gold IRA through a rollover from an existing 401(k) or traditional IRA. If that is a path you are considering, our 401(k) to Gold IRA rollover guide and Gold IRA rollover rules pages explain the process, timelines, and IRS requirements in plain detail. The IRS Publication 590-A is also worth bookmarking as a primary source.
Key Gold Price Milestones: 2021 at a Glance
Note: Prices are approximate and reflect intraday or closing ranges widely reported at the time. Past performance is not a guarantee of future results.
Protecting Yourself When Researching Gold IRA Companies
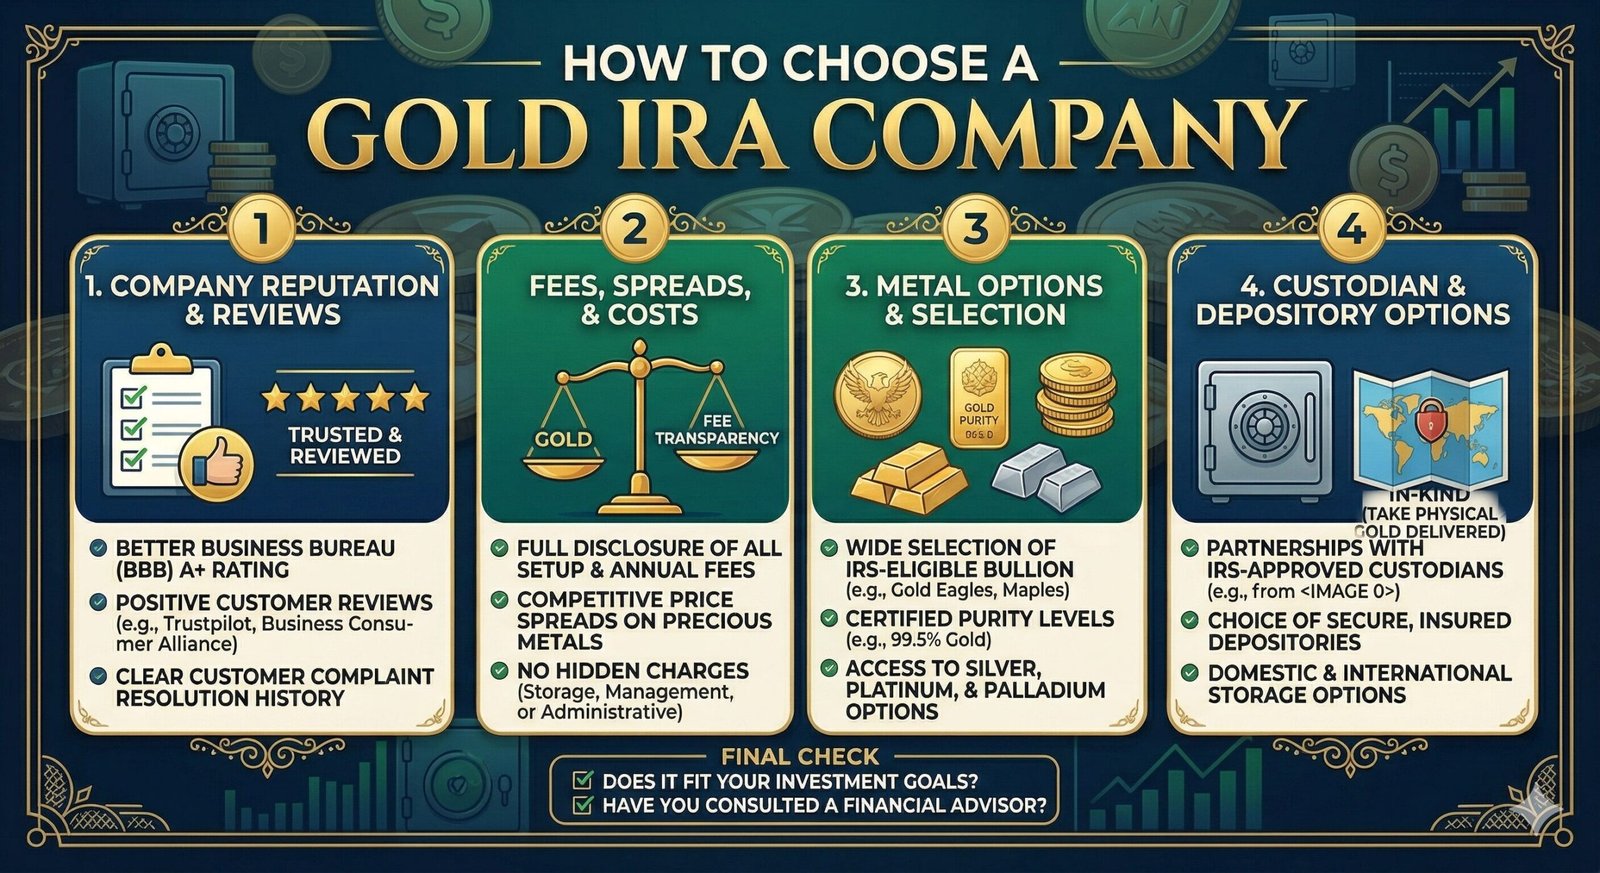
If 2021 sparked your interest in physical gold for retirement, one of the most important steps you can take is vetting any company you consider carefully. The Gold IRA industry includes many reputable operators — and some that are not. Our Gold IRA scams guide outlines the red flags to watch for. Checking company ratings on bbb.org and verifying any broker credentials through FINRA BrokerCheck are sensible starting points before committing to any provider.
Frequently Asked Questions
What was the gold price in 2021?
Gold opened 2021 at approximately $1,900 per troy ounce and closed the year near $1,800. The annual low came in March at around $1,680, and the metal spent much of the year trading within a broad range as macroeconomic conditions shifted. Past performance is not a guarantee of future results.
Why did gold fall in early 2021 despite high inflation?
Rising U.S. Treasury yields and renewed economic optimism following vaccine rollouts created headwinds for gold in early 2021. When real yields rise and the dollar strengthens, gold can face selling pressure from institutional investors — even in an environment where inflation is elevated. Gold’s relationship with inflation is not linear or guaranteed.
Did gold recover at any point during 2021?
Yes. Gold staged a partial recovery in May and June 2021, approaching $1,900 again, before softening through the second half of the year as Federal Reserve tapering expectations grew and the dollar gained strength. These movements illustrate the range of factors that can influence gold’s price at any given time.
Is 2021’s gold price history relevant to Gold IRA investors today?
Understanding how gold has behaved in different economic environments can help investors set realistic expectations. However, historical price data should not be used to predict future performance. Anyone considering a Gold IRA should focus on the structural details of those accounts — fees, rules, eligible metals, and provider quality — rather than short-term price history.
Where can I learn more about how Gold IRAs work?
A good starting point is our Gold IRA vs Traditional IRA comparison, which outlines the key structural differences between these account types. You may also want to review the SEC investor resources page for regulatory context on retirement account options.
Ready to Explore Your Options?
If reviewing gold’s behaviour in 2021 has you thinking more seriously about physical gold for your retirement accounts, the logical next step is understanding which companies offer Gold IRAs worth considering. Our independently researched roundup of the Best Gold IRA Companies of 2026 covers the providers we believe deserve a closer look, based on fee transparency, custodial quality, customer support, and regulatory standing.
This article is for informational purposes only and does not constitute financial or tax advice. Investing in precious metals involves risk including possible loss of principal.